

Two business services companies can reach the same revenue scale and still command radically different valuations.
At $300 million in revenue, a top-quartile operator with a 22.6% EBITDA margin and a 16x valuation multiple produces an estimated enterprise value of $1.08 billion. A bottom-quartile operator at the same revenue level, with a 5.9% EBITDA margin and an 8x multiple, produces an estimated enterprise value of $142 million.
The gap is roughly $940 million.
That is a 7.6x difference in enterprise value between companies operating in the same sector on the same revenue scale. The difference is not explained by size. It reflects the quality of the operating model underneath that revenue and, in many cases, the sequence in which leaders address coverage problems.
Key Takeaways
-
Business services firms at the same revenue scale can carry a 7.6x enterprise value gap.
At $300 million in revenue, a top-quartile profile reaches an estimated $1.08 billion in enterprise value, compared with roughly $142 million for a bottom-quartile profile. - The order of GTM and coverage moves can shape both EBITDA performance and valuation multiples.
Triage, Remap, Intensify, and Measure are all valid actions, but the wrong starting point can increase cost, delay margin recovery, or direct resources toward unsupported segments -
Only 24% of the 70 business services firms studied produced above-median growth and above-median EBITDA margin.
Those firms concentrated expansion inside coverage models that already worked, while the other 76% missed at least one performance threshold. - The correct first move depends on the company’s coverage profile.
Compounding Zone firms should Intensify first, Stretch firms should Remap, Scaling Wall firms should Measure, and Full Exposure firms should Triage. - A 100-day coverage reset should establish sequence before more capital is committed.
By day 100, leadership should have confirmed the coverage profile, funded the first move, started measurement, and set a start date for the next action.
Scale Does Not Protect Enterprise Value
Business services firms have spent years pursuing growth through acquisitions, geographic expansion, new service lines, and broader buyer coverage. Deal activity remains high. The sector completed 3,768 transactions in 2025, following 3,357 in 2024 and 3,906 in 2023.
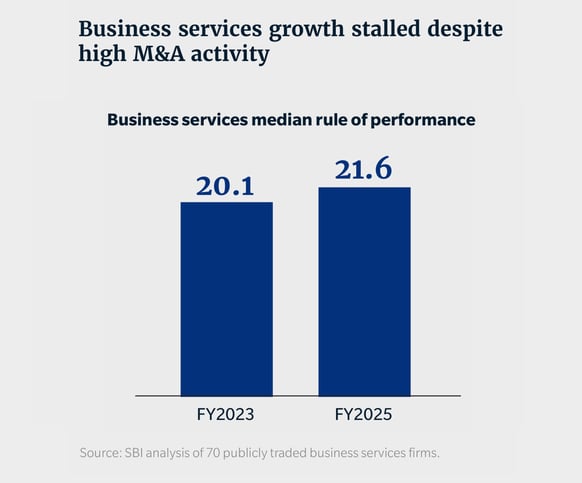
That activity produced little movement in sector performance. Across 70 publicly traded business services firms, the median rule of performance increased from 20.1 in FY2023 to 21.6 in FY2025.
The results split sharply beneath that median. Only 24% of the firms produced both above-median revenue growth and above-median EBITDA margin. Their expansion moves added density to coverage models that already worked, strengthening existing routes, labor pools, platforms, buyer relationships, and sales motions.
The other 76% missed at least one performance threshold. Many added geographies, services, and buyer groups without the operating structure needed to carry the added complexity.
By FY2025, the stronger group had reached a median Rule of performance of 32.2, which was 10.6 points above the sector median. Their advantage came from adding revenue where the operating model could support it.
The weaker group did not lack growth activity. It added breadth without enough shared infrastructure or commercial continuity to convert that activity into stronger economics.
The Moves Are Usually Right, The Order Is Often Wrong
Most executive teams facing margin pressure know the broad actions available to them. They can cut weak parts of the portfolio. They can redefine accounts and territories.
They can shift resources toward stronger opportunities. They can improve reporting and profitability visibility. The problem is that these moves do not produce the same result in every order.
The TRIM framework organizes the work into four actions:
-
Triage
Cut what is not working -
Remap
Redefine what counts as an account -
Intensify
Concentrate resources on the highest-density accounts -
Measure
Build the data foundation needed to direct the next move
Each action is valid, but the right starting point depends on the company’s coverage profile. Firms with strong infrastructure shouldn’t begin with cuts; those spread across unrelated segments shouldn’t add sales capacity first, and companies lacking account-level clarity shouldn’t redesign coverage before understanding profitability.
The order of these actions determines whether each step builds momentum or undermines progress.
A Cost Program Cannot Repair the Wrong Portfolio
TTEC Holdings and ISS A/S provide clear examples of how the sequence of strategic actions can determine financial outcomes. Both companies entered restructuring periods with extensive service portfolios, mounting margin pressures, and a critical need to reset their operating models.
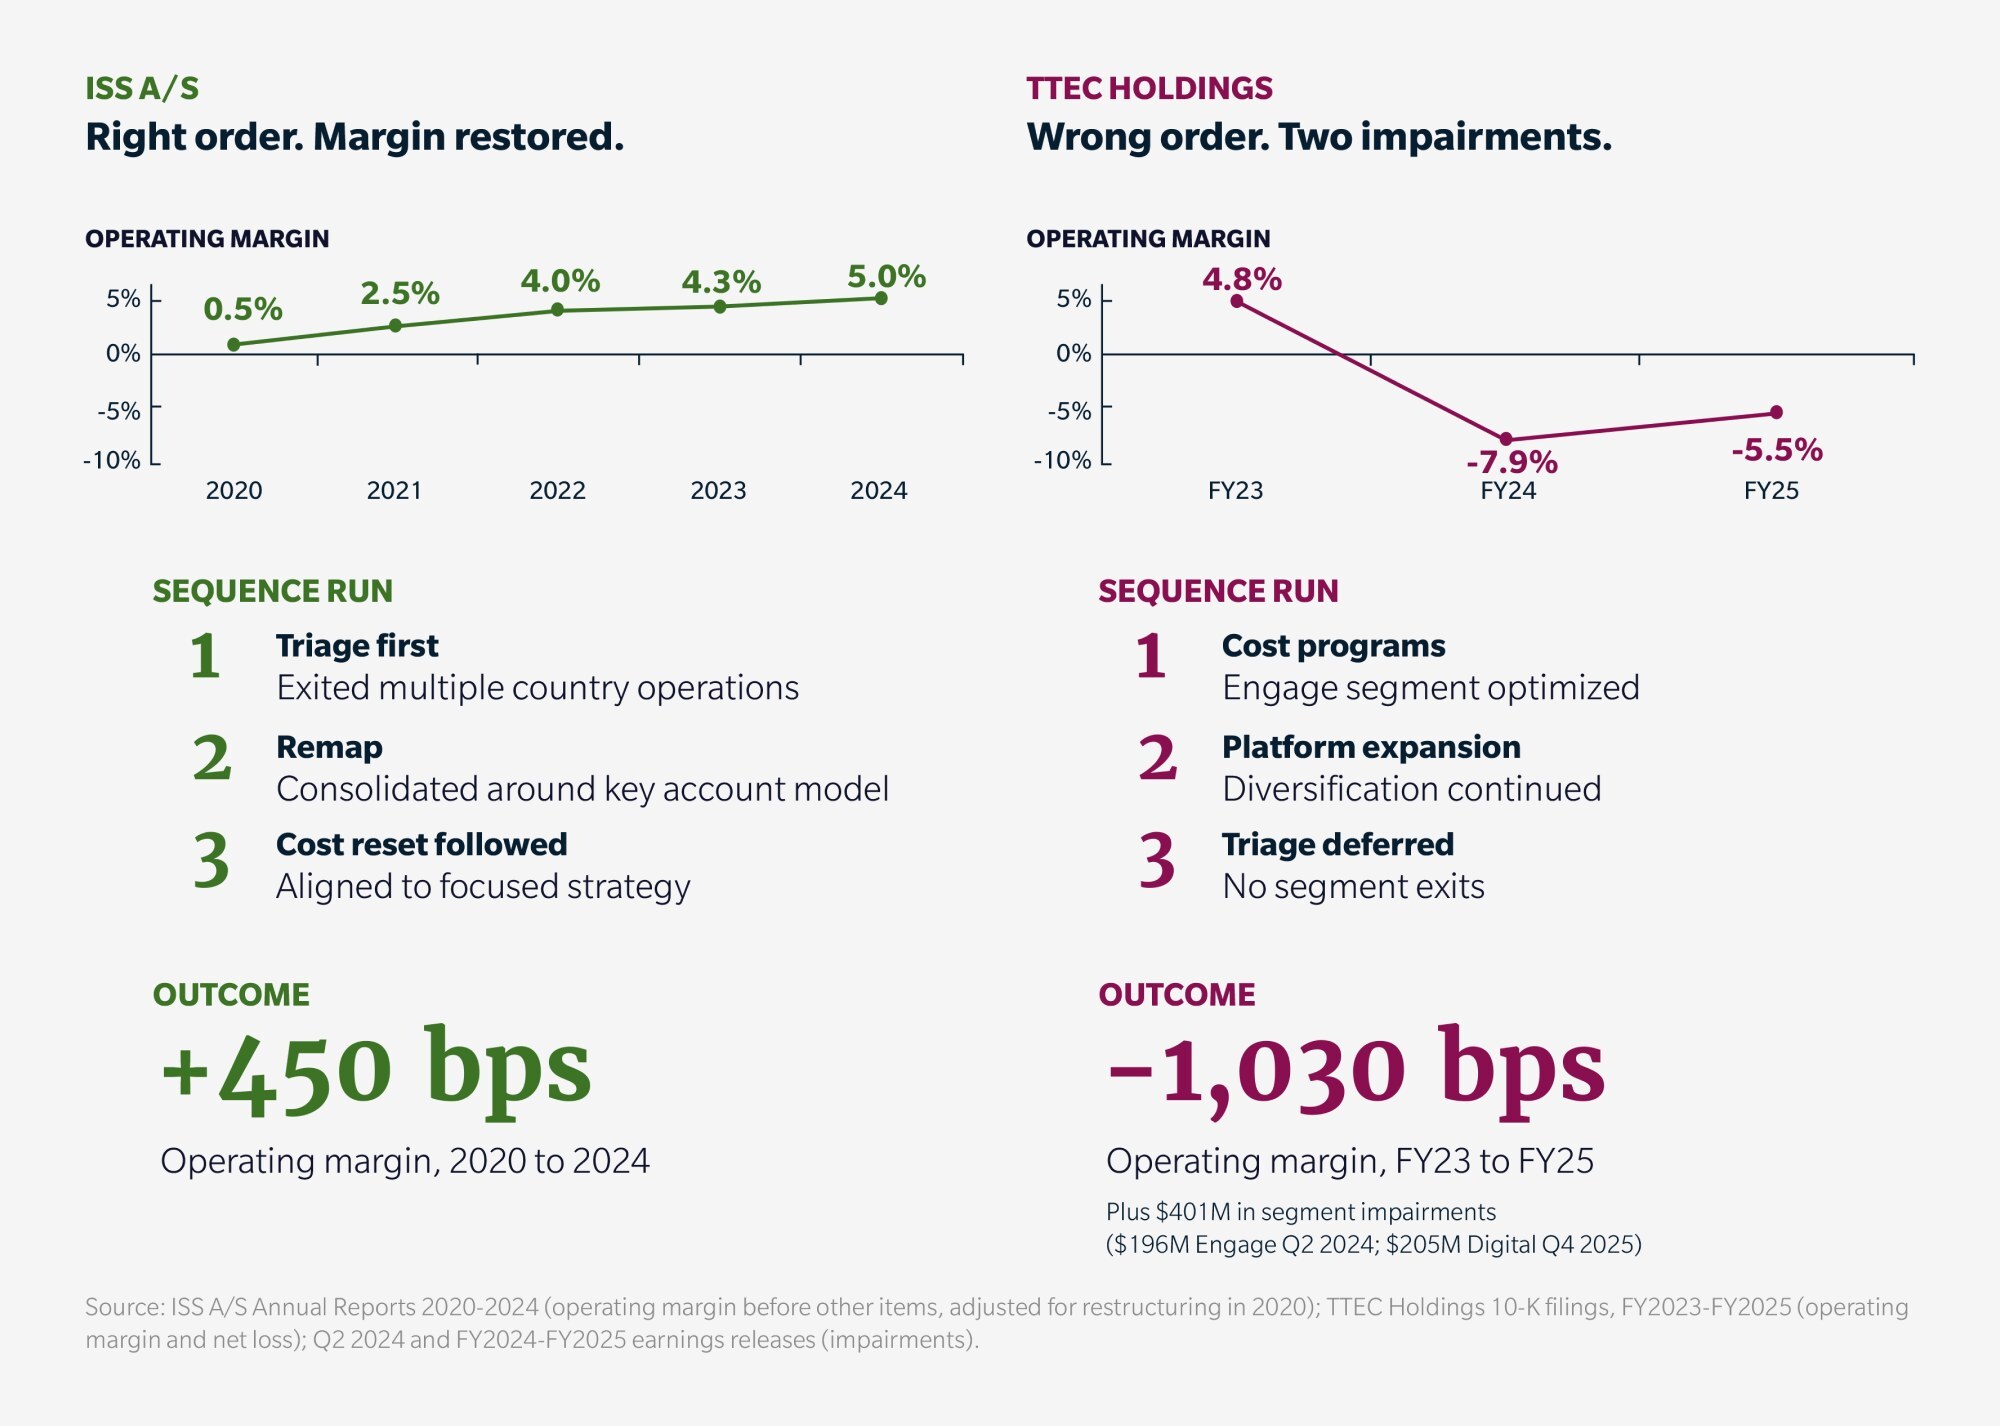
In 2024, TTEC’s management implemented a profit improvement program for its Engage segment, expanded its geographic delivery footprint, and continued investing in its Digital business. Despite these efforts, the company’s BPO operations continued to struggle due to pricing challenges brought on by AI advancements.
Even though TTEC met its cost-reduction targets, the core portfolio issues remained unresolved. The company reported a $196 million Engage impairment in the second quarter of 2024, followed by a $205 million Digital impairment in the fourth quarter of 2025. Over fiscal years 2024 and 2025, TTEC posted nearly $500 million in net losses, with its operating margin declining from 4.8% in 2023 to negative 5.5% in 2024 and negative 7.9% in 2025.
ISS A/S took a different approach by first reducing its portfolio exposure. The OneISS strategy involved exiting several country operations and focusing on an integrated facility services model built around key accounts. Cost actions followed only after these portfolio adjustments were made.
Over the same period, ISS increased its operating margin from 0.5% in 2020 to 5.0% in 2024.
The experience of these two companies highlights an important lesson. Cost reduction can strengthen an already viable operating model, but it cannot resolve a misaligned or unsupported portfolio. The lesson is not that Triage should always come first. It is that cost programs cannot compensate for a portfolio that should have been triaged before optimization began.
The Coverage Profile Sets the First Move
Two questions determine where a company should begin.
First, does the existing infrastructure carry the added segment? Routes, branches, systems, and labor pools should support the new business without creating a parallel operating layer.
Second, does the commercial model carry over? The same buyer, pitch, and sales motion should work without major redesign.
The answers place the company in one of four profiles.
1. Compounding zone
These firms have high infrastructure carryover and high commercial continuity. Their operating model already works. The first move is to intensify resource allocation toward the accounts and markets where density is producing returns.
Starting with broad cuts can damage the source of the premium. Service lines that appear redundant may still support route density, client retention, or share of wallet. The correct sequence is:
Intensify → Measure → Remap → Triage
For boards and investors, the key risk is unnecessary diversification. A bolt-on that expands the commercial footprint may weaken the density that supports the valuation multiple.
2. The stretch
These firms have strong infrastructure but weak commercial continuity. The underlying platform carries the work, but the company is selling across too many buyers, service structures, or account definitions.
One customer may appear as several accounts because each service line tracks it differently. The first move is to remap.
Until leadership corrects the account definition, resource allocation and portfolio decisions rely on distorted information. Cutting first may remove a service line that appears weak while leaving an important buyer uncovered. The correct sequence is:
Remap → Intensify → Triage → Measure
The financial challenge is timing. A serious account and territory redesign can take close to 12 months before margin recovery becomes visible. Management teams must track the operating milestones behind the reset rather than judge the work only by near-term revenue.
3. Scaling Wall
These firms have commercial continuity but weak infrastructure carryover. Sales knows how to win. Operations cannot support the volume profitably.
The first move is to measure account economics, operational bottlenecks, and segment performance. Without that visibility, adding sales capacity sends more volume into an operating system that is already strained. The correct sequence is:
Measure → Remap → Intensify → Triage
The capital allocation decision is often uncomfortable. Analytics, systems, and profitability reporting can appear less urgent than adding sellers. Yet commercial expansion without operating visibility can deepen the margin problem.
4. Full Exposure
These firms have low infrastructure carryover and low commercial continuity. The segments share little operational support and few common buyers. The portfolio may have been assembled through a series of acquisitions, but the assets do not operate as a single business. The first move is triage.
Remapping the full portfolio wastes time on businesses that should be exited. Adding resources increases exposure. Leading with Measure creates a more detailed view of a portfolio that should first be reduced. The correct sequence is:
Triage → Remap → Intensify → Measure
This is the profile where partial action carries the greatest risk. Exiting revenue without resetting the cost base leaves the remaining business carrying overhead it cannot support.
The Board-Level Question Is Not "What Should We Do?"
The most important board-level question is not simply what actions to take, but which move should come first. While most leadership teams can identify programs to improve performance, determining the right starting point is critical.
This decision needs to be made before approving the next operating plan, acquisition, restructuring program, or sales capacity increase. Without clear sequencing, companies risk funding multiple initiatives that unintentionally work against each other.
For example, a Full Exposure company might expand its platform while also considering divestitures. A Stretch company could cut service lines before addressing account structure. A Scaling Wall company may approve new territories before establishing account profitability reporting.
Each initiative may seem rational in isolation, but when executed in the wrong order, they reinforce the underlying issues instead of solving them.
The First 100 Days Should Establish Order
The initial 100-day coverage reset should do three things.
-
Day 1 through 30
This decision needs to be made before approving the next operating plan, acquisition, restructuring program, or sales capacity increase. Without clear sequencing, companies risk funding multiple initiatives that unintentionally work against each other.
-
Day 31 through 60
Capital and leadership attention should shift to the first move. A Compounding Zone company reallocates field capacity. A Stretch company starts the account and territory redesign. A Scaling Wall company assigns ownership for the data and profitability build. A Full Exposure company identifies the segments to exit.
-
By day 100
The first move should be funded, the measurement should be underway, and the next move should have a start date.
A first move run in isolation will not change the company’s trajectory. The financial benefit appears when each step creates the conditions for the next.
Enterprise Value Follows Operating Coherence
The $940 million valuation gap is not a universal forecast for every business services company. Instead, it shows how differences in margin quality and market confidence can create vastly different outcomes, even at the same revenue level.
Top-quartile companies benefit from stronger EBITDA margins and higher valuation multiples, while bottom-quartile companies suffer from weaker margins and discounted multiples. Poor execution affects both profitability and investor perception, compounding the downside.
When margin pressure reduces earnings and a weak operating model drives down valuation multiples, a company loses value on two fronts. This double hit underscores why the order of strategic moves is critical.
For executives and operating partners, the key takeaway is clear. If the coverage model is misclassified, executing the right actions in the wrong sequence can lock in the very performance gap you’re trying to close.
Ask yourself: Is your current operating plan solving the real coverage problem, or simply funding the wrong sequence of actions? For guidance, review the four coverage profiles and the recommended 100-day sequence in The Coverage Reset